- +31-624-845-535
- info@plabottles.eu
- in need of compostable packaging?
- Let's connect
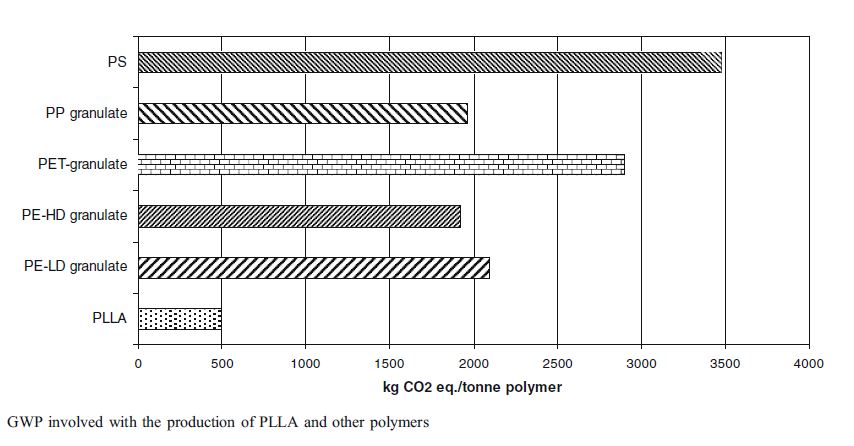
Petroleum-based plastics production has increased from 15 million tonnes in 1964 to 311 million tonnes in 2014 and it is estimated double in the next 20 years. Plastics derived from fossil resources are causing different concerns, such as the greenhouse gas emissions (GHGs), resource depletion, and rise of oil prices. These concerns with petroleum-based plastics are generating interest in bioplastics. Many studies have focused on GHGs of bioplastics but studies focusing on water and land footprints of bioplastics are rare.
This study aims to calculate the water and land footprint of bioplastics in several scenarios where all plastics are bio-based and assume different types of biomaterials and recycling rates. Calculation of such scenarios are carried out through a number of steps. The step to calculate the water and land footprint are: (i) listing the inventory of different biomaterial, (ii) estimating the efficiency of biomaterials, (iii) estimating the water and land footprint of sources materials, (iv) calculating the water and land footprint of final products, and (v) calculating the total water and land footprint if all fossil feedstock plastics were replaced by bioplastics. The types of bioplastics studied in this research are polyethylene (PE), polyethylene terephthalate (PET), polylactic acid (PLA), polyurethane (PUR), polypropylene (PP), and polyvinyl chloride (PVC). These plastics are selected because they are the main types of plastic materials used globally. Over 70% of the total demand of plastics is satisfied through these five types of plastics. Moreover, polylactic acid (PLA) is also studied because it is the most promising bioplastic and it can replace many functionalities of fossil-based plastics.
In this study, nine sets of assumptions are used. Three sets of assumption relate to the types of
biomaterials used and three sets of assumption relate to different recycling rate. The types of
biomaterials used is selected based on the result of water and land footprint calculation. Biomaterial with the highest water and land footprint value represents the ‘high’ value assumption, the lowest value represents the ‘low’ value assumption, and an average value represents ‘average’ value assumption. However, only PE, PET, and PLA have more than one type of biomaterial. For the recycling rate, there are three scenarios as well which are 10%, 36%, and 62%. The selected rates correspond to the recycling rates for today, the target recycling rate of EU in 2020, and a rate of all plastics that are possible to recycle.
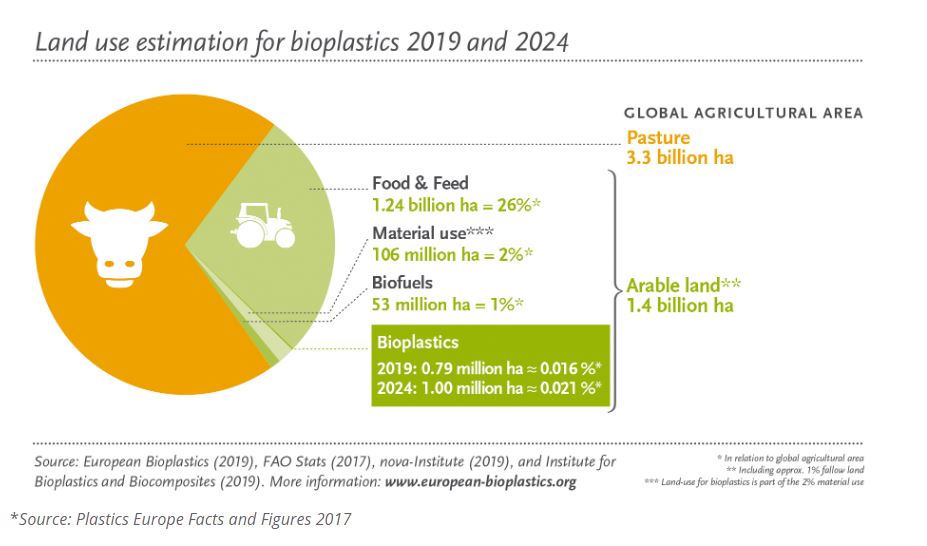
This study shows that the water footprint of bioplastics vary between 1.4 m 3 /kg to 9.5 m 3 /kg. The land footprint of bioplastics vary between 0.7 m 2 /kg to 13.75 m 2 /kg. The water footprint if all the fossilbased plastics replace with bio-based plastics varies from 307 billion to 1,652 billion m 3 per year. If this number compare to global annual average water footprint (9,087 billion m 3 /year), it accounted about 3% to 18% of the global annual average water footprint. The land footprint of a complete shift varies from 30 million to 219 million hectares per year. If it compares to free arable land in 2020 which account about 360 million hectares, the land footprint of this replacement will take about 8% to 61%.


